Pricing Analysis – Optimizing a Fee Schedule
Note: To protect my client’s confidentiality, the information presented has been obfuscated and does not reflect actual data. For simplicity, I will refer to my client as ACME, Inc.
ACME presented me two questions: 1) How does their pricing stack up against that of their competitors? 2) How much room do they have to adjust their pricing while still remaining the best value in the market?
These were not particularly easy questions to answer because ACME’s pricing model was complex. ACME invoiced its customers based on 7-10 factors, similar to how UPS bills based on weight, package dimensions, destination, day of the week, etc. whereas USPS simply charges $.49 to deliver a letter from here to anywhere. The competitor price schemes varied in complexity, but were on balance much simpler.
To help analyze the situation, I built a financial model that incorporated ACME’s real-time customer data to calculate how the current pricing compared to a new pricing scheme they wanted to implement, as well as in relation to all their competitors’ pricing. ACME also wanted to know how different customer segments would be affected (i.e. large vs small volume) and how any given customer would fare with the new pricing as compared to getting similar service from the competition.
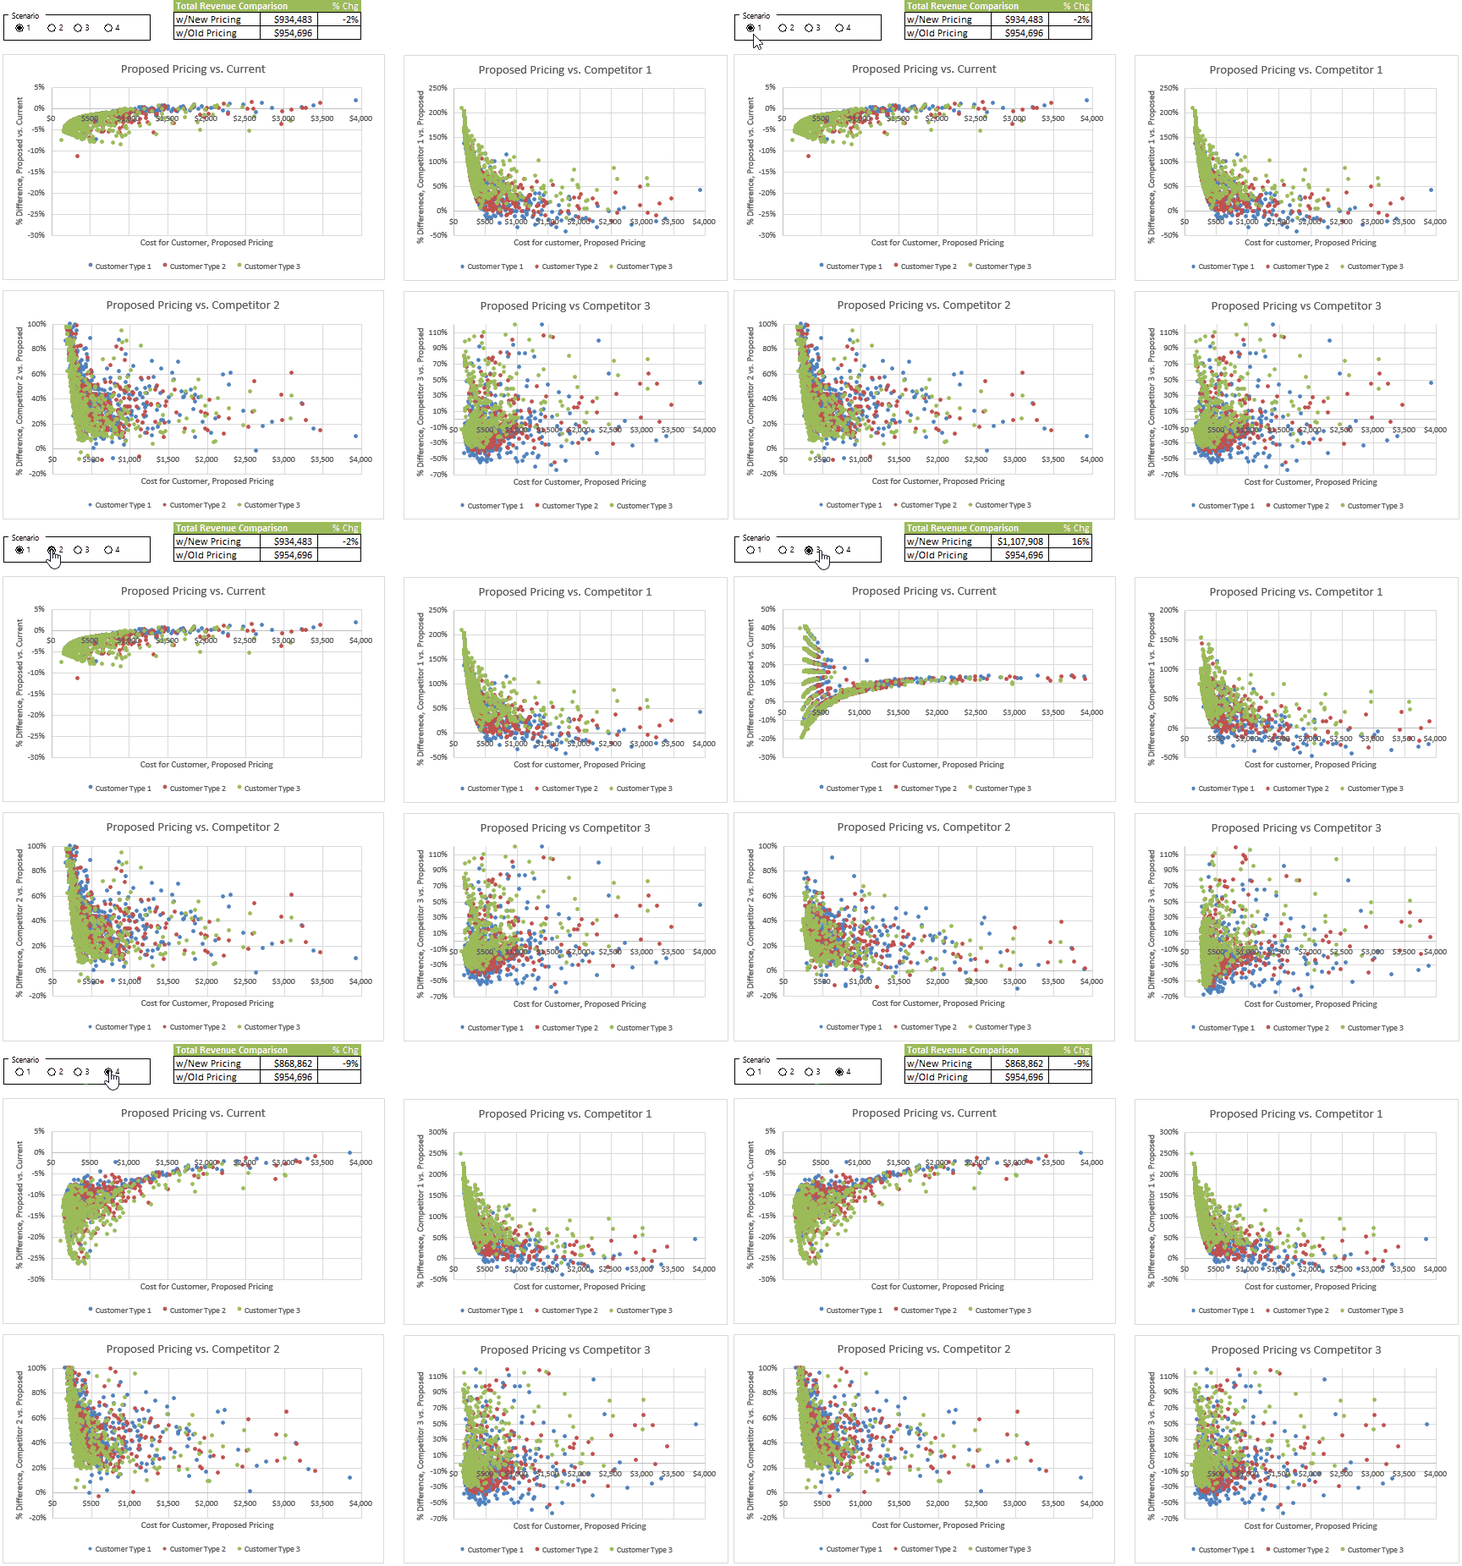
The Excel model factored in the minutia of every pricing scheme to calculate an estimated total cost for each of ACME’s existing customers. Naturally, this produced even more data and I used a scatterplot to visualize the information:
- Each scatter plot compares two pricing models (ACME’s old pricing vs. proposed pricing, or ACME’s new pricing vs a competitor’s pricing)
- Each dot on the scatterplot represents one of ACME’s customer, the dot’s color represents the customer’s category (the details of the segmentation are proprietary).
- The x-axis represents the cost for the customer using ACME’s new proposed pricing
- The y-axis represents the % change in cost for that customer compared to the competitor scheme. Therefore, any dots above 0 on the y-axis (when comparing to a competitor) indicate customers who will have lower prices with ACME vs. the competitor.
- The model also allowed a user to modify the price scheme directly and see how the change affected revenue and competitive standing.
Using the tool, ACME coalesced on a simplified scheme that was easier for clients to understand that projected a total revenue that met ACME’s financial goals. Because the new scheme was a much flatter (with fewer variables), it was to be expected that some clients would see fluctuations in their new invoice compared to their previous ones. In other words, some would see an increase, and some would see a decrease.
To understand this more clearly, consider the imaginary price scheme below for a company that produces injection-molded widgets:
- Base fee: $500
- Cost per widget: $200
- Fee to create injection mold: $1000
- Add’n cost per widget for any widget over 1kg: $100
Now suppose that the scheme was simplified by removing the fee to create the mold, and to compensate for the lower revenue the company increased its other fees:
- Base fee: $600
- Cost per widget: $250
- Fee to create injection mold: $1000
- Add’n cost per widget for any widget over 1kg: $125
Any customers that needed many different types of molds would enjoy a significant decrease in fees since they would no longer pay a fee each time they used a new mold whereas all other customers would see an increase.
ACME faced a similar dilemma so to minimize these fluctuations for customers I ran a multiple regression analysis on the new price scheme. This returned the price points to set for each variable that would minimize fluctuations (and complaints) from existing customers.
In the end, the analysis proved to be a useful tool in convincing ACME’s management to make the change and ACME achieved its new revenue goal with virtually no customer attrition.
Technical Discussion
I developed this analysis from end-to-end.
- I created the base financial model in Excel to estimate pricing for a large representative sample of customers. The model depended on several inputs:
- Customer data which I extracted from ACME’s database with SQL query that I wrote.
- Fee schedules for ACME and its competitors.
- Customer segmentation criteria specified by ACME
- I took advantage of some advanced Excel features like linked radio buttons and VBA to allow users to easily toggle between scenarios, thereby making the analysis very interactive.


0 Comments